Empower data-driven decision making for your business with our holistic data analytics and visualization solution, Data V.
Data V excels in simplifying interactions with data from diverse sources. Leveraging its advanced data integration capabilities, the tool goes beyond surface-level insights, delving into the intricacies of heterogeneous data sources. By doing so, Data V unveils hidden patterns, identifies emerging trends, and uncovers valuable relationships that might otherwise remain unnoticed in the complex data landscape. This transformative approach ensures that users can extract maximum value from their data.
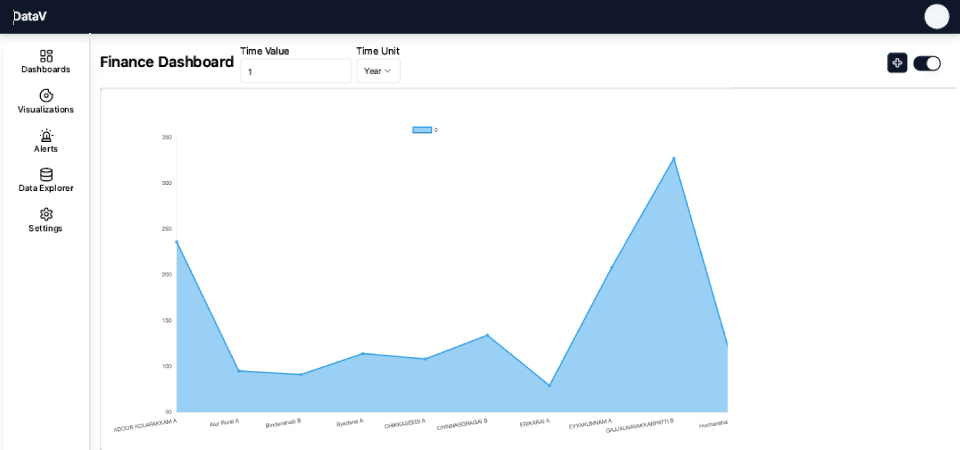
Data V goes beyond conventional reporting by delivering a rich, consolidated view of essential information. It ensures a comprehensive and centralized perspective on key data, seamlessly aggregating insights regardless of their storage location. By breaking down data silos and providing a unified view, Data V empowers users to extract meaningful insights. In short, Data V fosters a holistic understanding of critical information that is pivotal for effective decision-making across diverse organizational facets.

Data V prioritizes the security of your information with a focus on live integration to on-premises data sources. This secure integration extends across the entire spectrum of organizational data, ensuring that insights are derived and shared with the utmost confidentiality and integrity. By implementing stringent security measures, Data V safeguards against potential risks. This approach not only protects sensitive information but also promotes a culture of trust and compliance in managing critical organizational data resources.
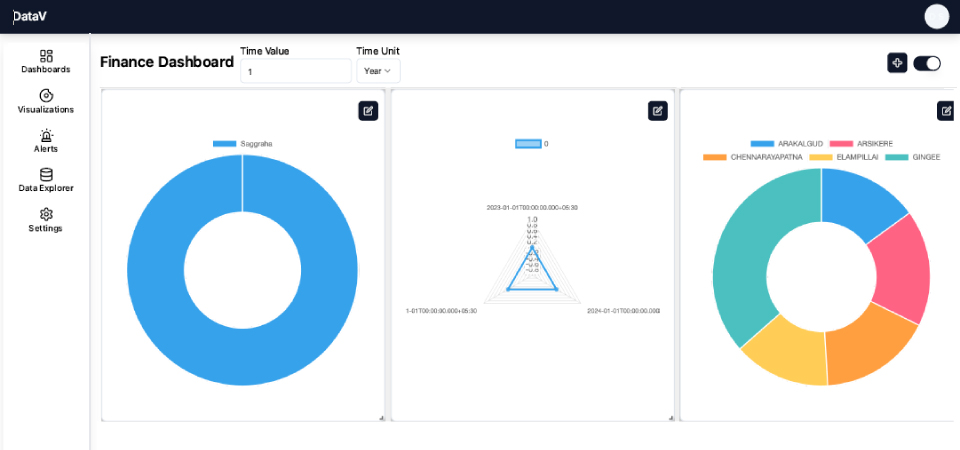
Data V serves as a powerful catalyst for expediting and enhancing the decision-making process within a business context. By presenting complex datasets in a visually intuitive manner, Data V enables stakeholders to quickly and easily grasp key insights and trends. The ability to interpret and analyze data through visual representations not only accelerates decision-making but also ensures a deeper understanding of the underlying patterns and correlations.
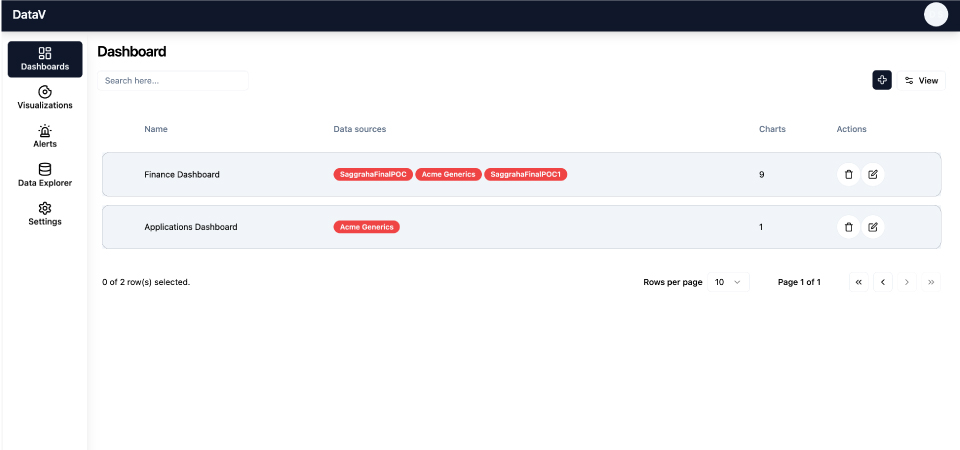
Data V offers an end-to-end view that encompasses every facet of your operations. This panoramic insight is derived from the dynamic integration and visualization of diverse datasets. It allows stakeholders to monitor key performance indicators, track progress, and identify trends across various departments and functions. By consolidating information into a unified and visually accessible platform, decision-makers gain the ability to assess the overall health of the business at a glance.
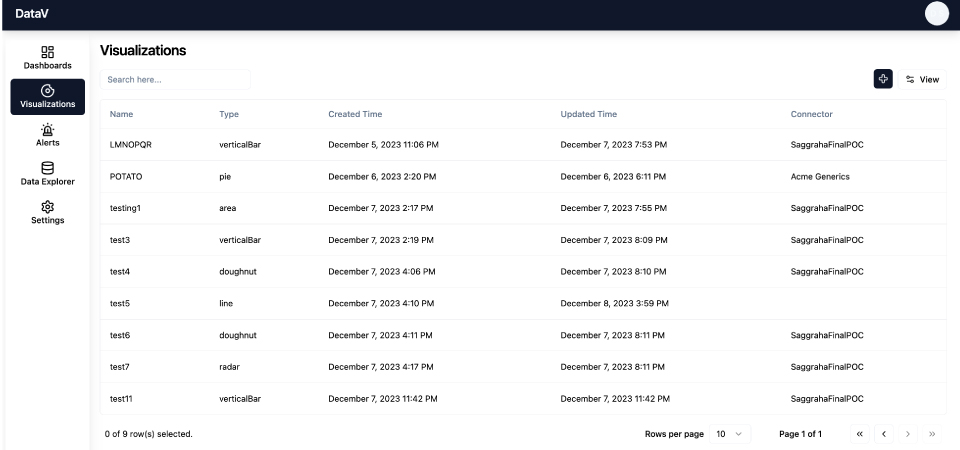
Data V excels in simplifying interactions with data from diverse sources. Leveraging its advanced data integration capabilities, the tool goes beyond surface-level insights, delving into the intricacies of heterogeneous data sources. By doing so, Data V unveils hidden patterns, identifies emerging trends, and uncovers valuable relationships that might otherwise remain unnoticed in the complex data landscape. This transformative approach ensures that users can extract maximum value from their data.


Data V goes beyond conventional reporting by delivering a rich, consolidated view of essential information. It ensures a comprehensive and centralized perspective on key data, seamlessly aggregating insights regardless of their storage location. By breaking down data silos and providing a unified view, Data V empowers users to extract meaningful insights. In short, Data V fosters a holistic understanding of critical information that is pivotal for effective decision-making across diverse organizational facets.
Data V prioritizes the security of your information with a focus on live integration to on-premises data sources. This secure integration extends across the entire spectrum of organizational data, ensuring that insights are derived and shared with the utmost confidentiality and integrity. By implementing stringent security measures, Data V safeguards against potential risks. This approach not only protects sensitive information but also promotes a culture of trust and compliance in managing critical organizational data resources.


Data V serves as a powerful catalyst for expediting and enhancing the decision-making process within a business context. By presenting complex datasets in a visually intuitive manner, Data V enables stakeholders to quickly and easily grasp key insights and trends. The ability to interpret and analyze data through visual representations not only accelerates decision-making but also ensures a deeper understanding of the underlying patterns and correlations.
Data V offers an end-to-end view that encompasses every facet of your operations. This panoramic insight is derived from the dynamic integration and visualization of diverse datasets. It allows stakeholders to monitor key performance indicators, track progress, and identify trends across various departments and functions. By consolidating information into a unified and visually accessible platform, decision-makers gain the ability to assess the overall health of the business at a glance.


 Salesforce
 Gitlab
 Dynamic BC
 Sharepro
 Firebase
 Mongo DB
 Elastic Search
 Cockroach DB
 Cassandra
 Dynamo DB
 Couchbase Capella
 Redis
Redis Couch DB
 CSV
CSV Excel
Excel JSON
JSON Sharepoint
 ServiceDesk Plus
  ME Endpoint Central
 MySQL
MySQL SAP HANA
 PostgreSQL
 Oracle
 MariaDB
 MSSQL Server
 IBM DB2
 Supabase
 OneHash
 LOQ
LOQ CEIPAL
 HROne
HROne


SAP HANA, Salesforce, MS Dynamics 365 BC — and counting. Easily connect and sync with leading enterprise solutions.


Integrate HRMS like HROne, and ITSM tools such as ServiceDesk Plus to streamline operations.


SQL: MySQL, PostgreSQL, Oracle, SQL Server
NoSQL: MongoDB, Firebase, Cassandra


Easily ingest data from CSVs, Excel, JSON, XML, and more - no complexity involved.


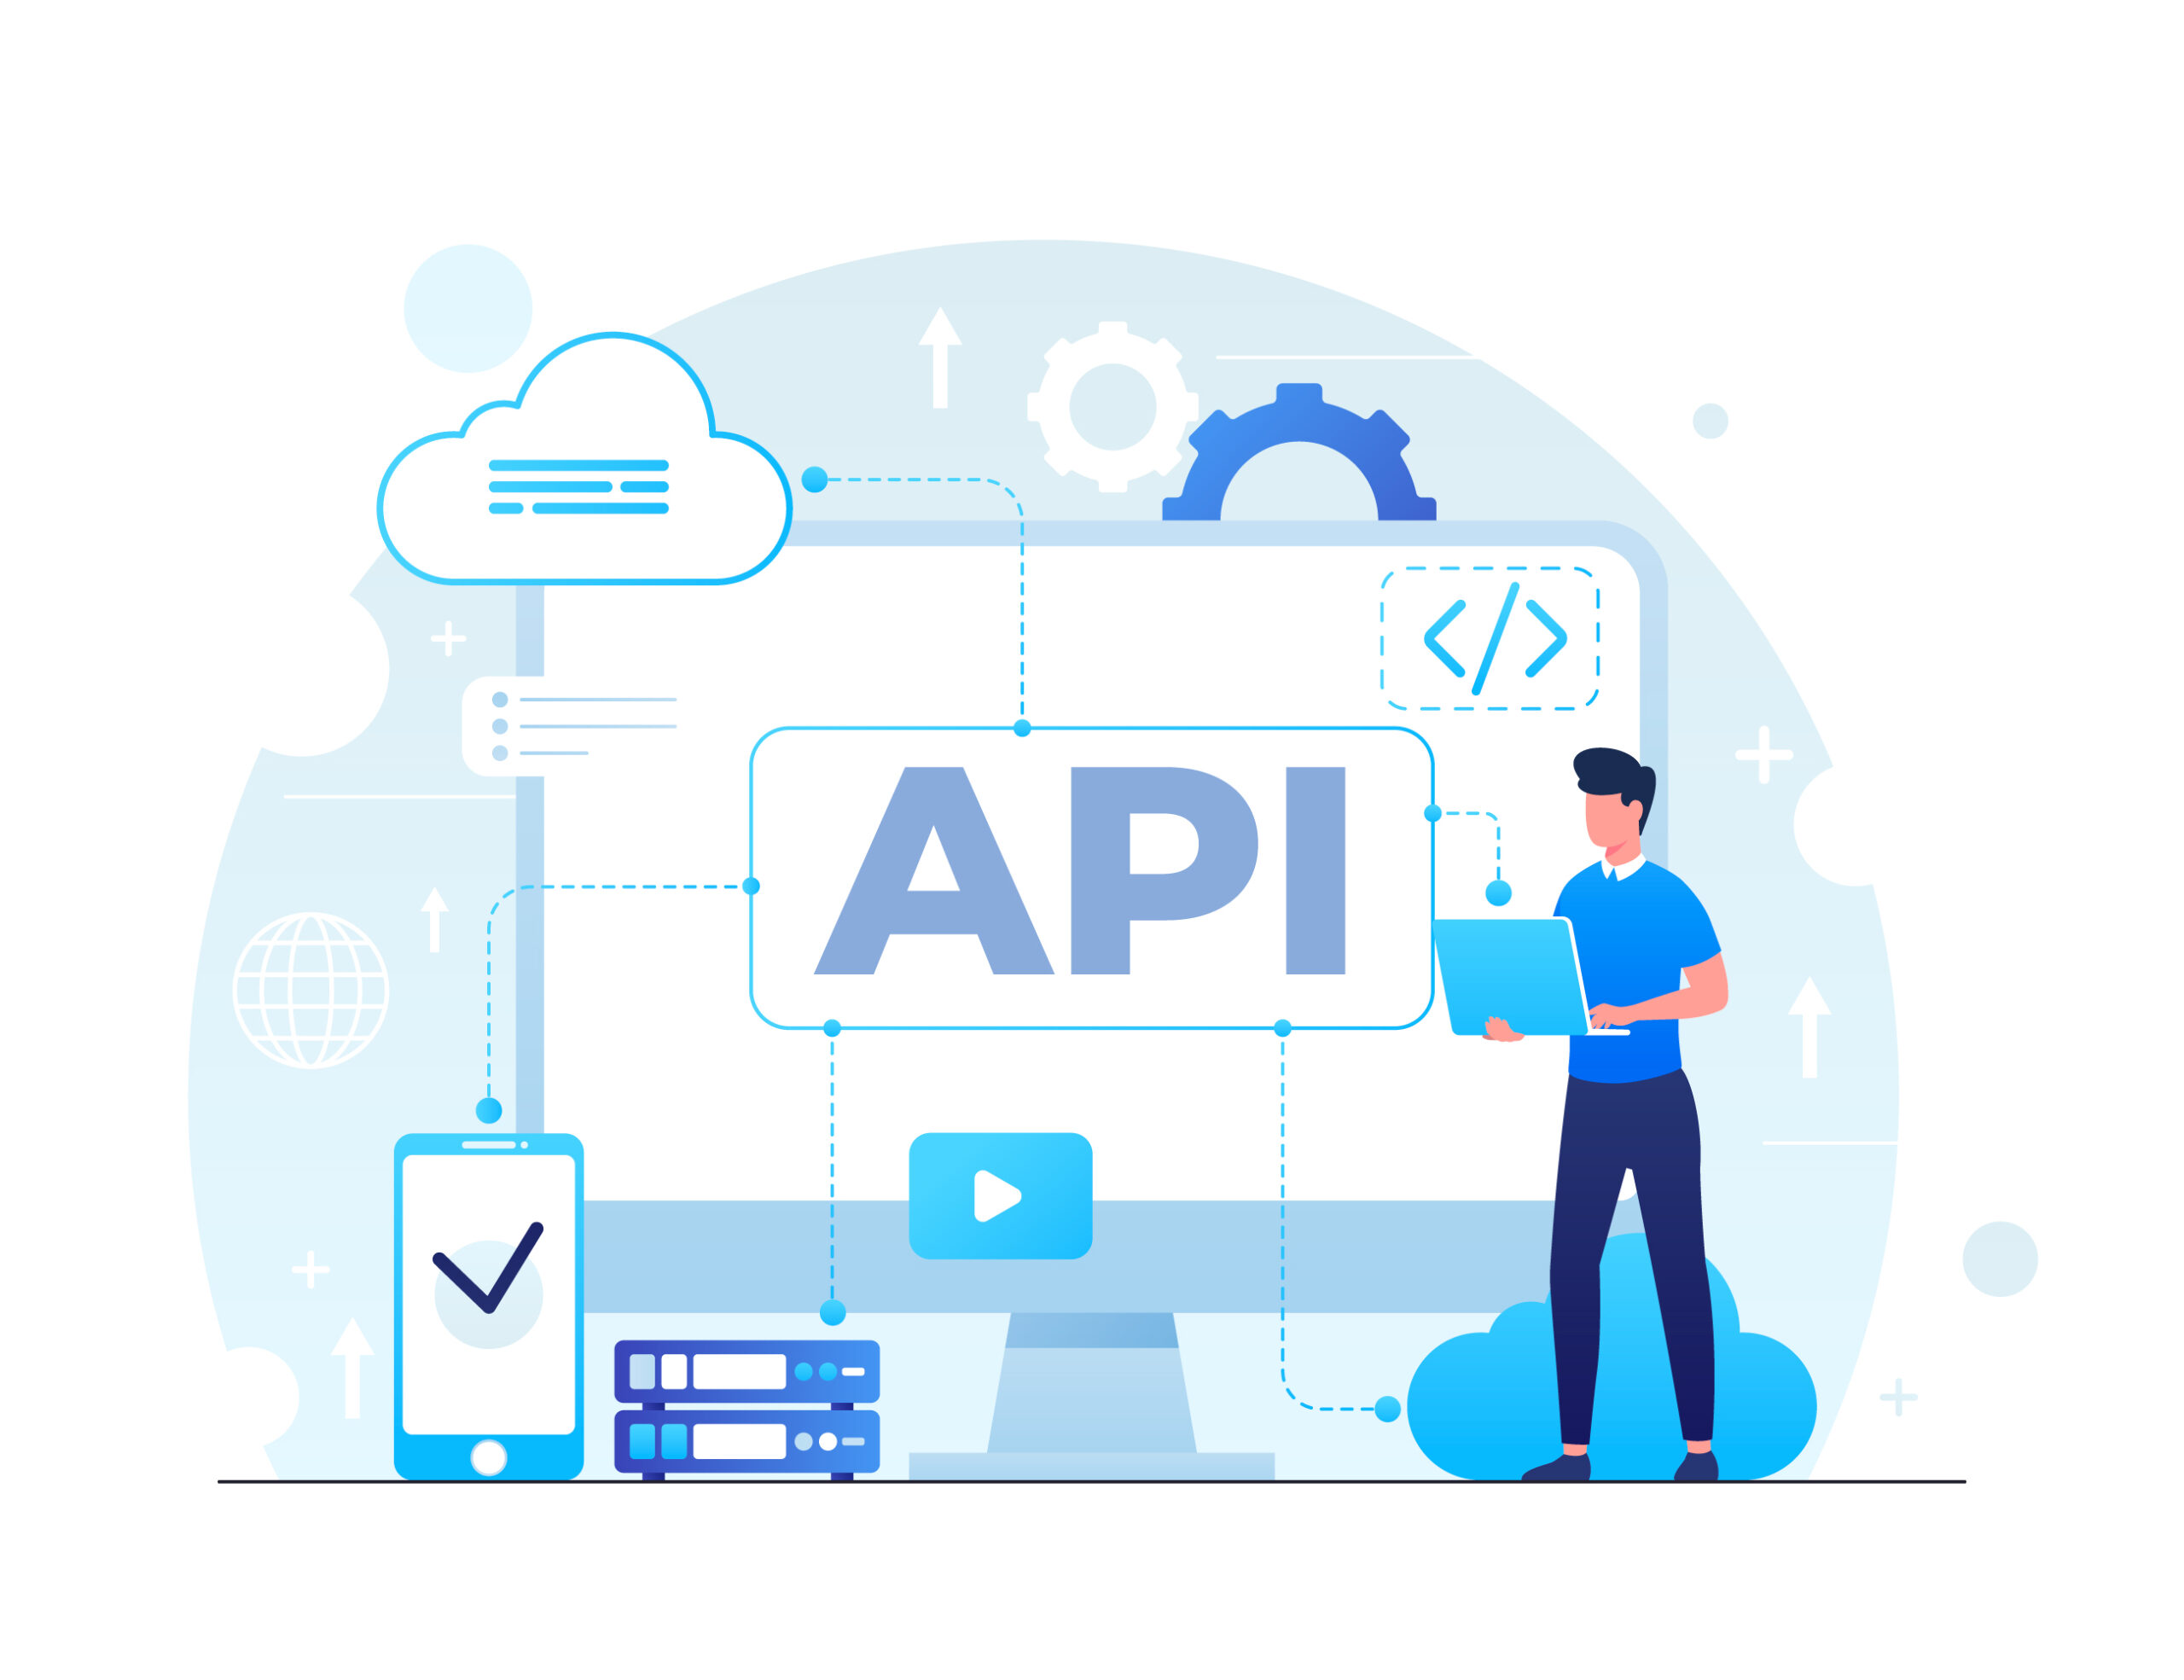
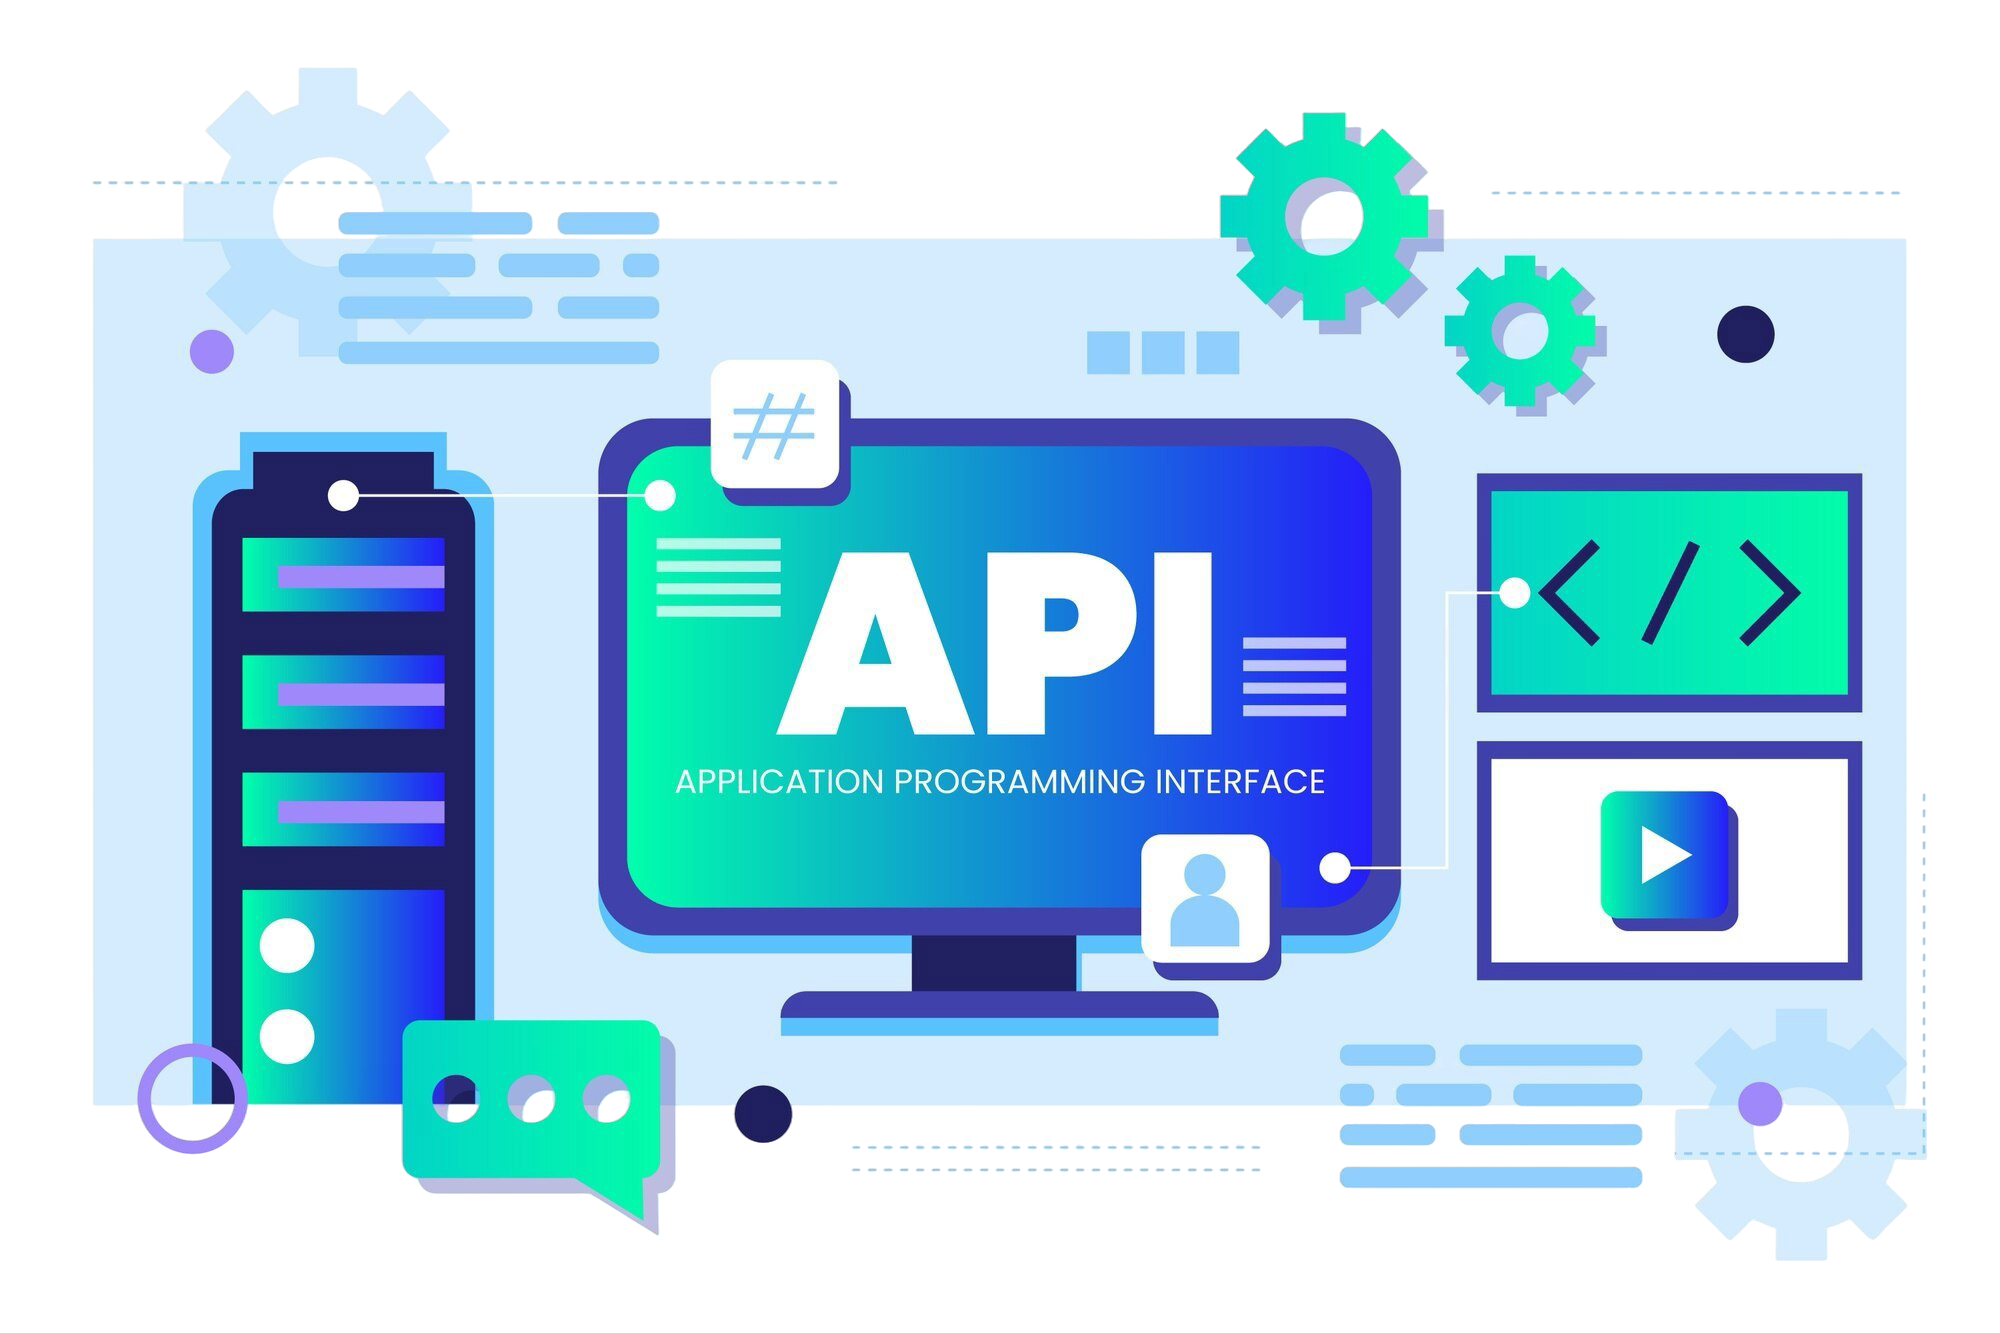
If it speaks REST, we can talk to it - bring in data from any modern API source effortlessly.
Get a full-circle understanding of your business through insights across all aspects of your organization.

At Skillmine, we are dedicated to simplifying the complex world of compliance management. Our mission is to empower organizations, regardless of their size, to navigate regulatory landscapes with confidence.
© 2026 DataV. All rights reserved.