A business might have months of sales reports, customer data and operational figures at its disposal and still struggle to answer a simple question: what’s actually working?
The information is there, but finding the answer is not always straightforward. One team might be looking at spreadsheets, another at dashboards, while important figures sit in entirely different systems. Bringing everything together can take more effort than analysing the data itself.
Where do businesses lose sight of their data?
Take a company operating across multiple locations. Its sales team tracks revenue, finance monitors costs and operations keep an eye on performance. Each department has its own reports, but getting a complete picture of the business means looking across all of them.
This is one reason businesses are turning to a Business Intelligence Platform. Having information in one place makes it easier to compare figures, follow changes and investigate what’s behind them.
What should businesses expect from Business Intelligence Tools?
A dashboard full of charts is not particularly useful if people still have to work out what the numbers mean.
How does Data Visualization help?
GoodData Visualization Solutions allows you to see differences that are not obvious otherwise. A change in sales across locations, a shift in customer behaviour or an unexpected rise in operating costs becomes easier to investigate when the information is presented clearly.
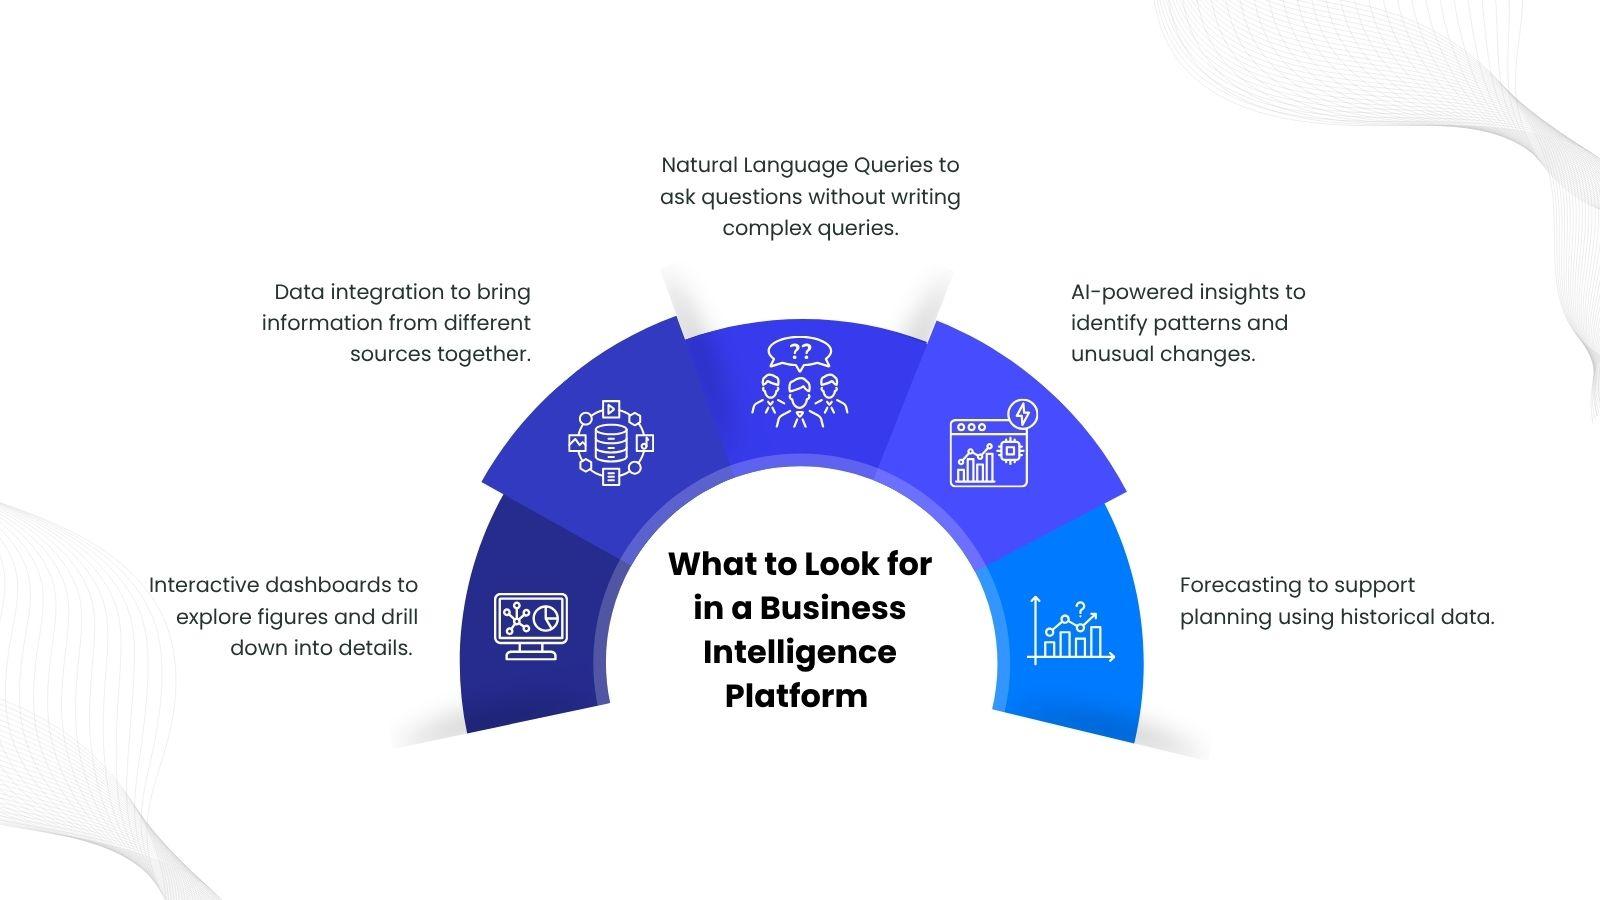
Skillmine DataV offers interactive dashboards, over 30 chart types, data correlation, AI-powered insights and forecasting capabilities. It gives teams more ways to explore business information without having to piece together multiple reports.
The challenge was never simply collecting more data. It’s being able to find the answers hidden in it.